We are now in a golden age of digital marketing. Across all functions of a company, the marketing department has most embraced the concepts of experimentation. No longer confined to the largest companies or the strongest brands, experimentation has allowed marketers to push the boundaries of the art of the possible. And internet technology has made experimentation easier than ever.
However, companies’ interest in analytics to measure marketing results seems to lag their interest in experimentation. An experiment needs to be carefully designed and then carefully measured. Now, experiment design is a huge topic in itself. However, measurement should be straightforward with a little math and a little practice.
One of the most important topics in marketing is measuring sales lift. Unfortunately, most of the existing discussions either gloss over the math necessary to motivate the discussion or they focus solely on the theory without practical examples. This article provides both the mathematical theory and practical marketing examples of how to calculate sales lift.
What is Sales Lift?
In marketing, sales lift is the improvement of sales against a benchmark. In a marketing experiment, it is the measure of how much a change to our marketing approach can increase sales compared to the existing marketing approach. Examples of changes include a new promotion, a new layout, or a newly worded message.
To calculate sales lift, we need to design the experiment and collect results. Then, it’s down to math. We will cover two methods:
- The percentage method
- The odds ratio method
The percentage method is by far the most popular approach to calculate sales lift. In contrast, the odds ratio is far less widely known or widely used (outside of academia). However, it is a powerful technique that (after working through the math) is easy to incorporate.
This article covers both the mathematical theory and practical examples of how to calculate sales lift using both methods. In addition, its aim is to promote the odds ratio method as an alternative to the percentage method (when applicable).
The Percentage Method to Calculate Sales Lift
Suppose that we are working with an online retailer that sells consumer goods. The marketing department decides to run a new marketing experiments. They perform an A/B test, in which during checkout, some customers receive a promotion that incentivizes them to increase their order size.
Customers in the control group (Group A) do not receive the promotion. Customers in the test group (Group B) do see the promotion.
At the end of the day, the results of the A/B are as follows.
| Control (Group A) | Test (Group B) |
|---|---|
| $57 | $30 |
| $54 | $64 |
| $64 | $74 |
| $44 | $88 |
| $45 | $28 |
| $39 | $41 |
| $64 | $31 |
| $42 | $54 |
| $52 | $82 |
| $39 | $54 |
| $41 | $29 |
| $32 | $65 |
| $40 | $46 |
| $44 | $53 |
| $43 | $54 |
| $65 | $49 |
| $38 | $62 |
| $67 | $37 |
| $45 | $94 |
| $63 | $69 |
| $40 | $58 |
| $64 | $65 |
| $40 | $37 |
| $64 | $85 |
| $68 | $40 |
| $69 | $49 |
| $39 | $63 |
| $35 | $61 |
| $52 | $76 |
| $63 | $65 |
| $58 | $40 |
| $57 | $62 |
| $47 | $39 |
| $36 | $72 |
| $55 | $65 |
| $44 | $47 |
| $47 | $53 |
| $63 | $47 |
| $53 | $79 |
| $38 | $57 |
| $41 | $44 |
| $57 | $74 |
| $61 | $63 |
| $48 | $61 |
| $38 | $66 |
| $57 | $75 |
| $38 | $66 |
| $40 | $57 |
| $36 | $78 |
| $34 | $41 |
| $53 | |
| $42 | |
| $45 | |
| $55 | |
| $45 | |
| $41 | |
| $56 | |
| $45 | |
| $61 | |
| $55 |
To calculate sales lift with the percentage method, we start off with some definitions.
![]()
The formula for lift is:
![]()
Thus, in this example.

In other words, our marketing experiment resulted in a 15% increase in customer order value at checkout.
The Odds Ratio Method to Calculate Sales Lift
Now, suppose that our online retailer runs a promotional email campaign every month. Customers can receive a limited-time product if they sign up for our subscription service. The cost of the subscription is $100.
A marketing associate proposes a clever change in email design. To test the change, the marketing department splits this month’s promotion into two groups:
- 868 offers in the test group (a.k.a., the newly changed promotional email)
- 810 offers in the control group (a.k.a., the previous promotional email)
The marketing department runs the campaign. After seven days, the results of the two promotional offers is as follows.
| Test (Group B) | Control (Group A) | |
|---|---|---|
| Accept | 32 | 18 |
| Decline | 836 | 792 |
| Total | 868 | 810 |
Now, when we evaluate our results, we see that:
- The test group had 32 acceptances out of 868 offers, for a 3.7% response rate and a total of $3,200
- The control group had 18 acceptances out of 810 offers, for a 2.2% response rate and a total of $1,800
So, let’s calculate sales lift with our second method.
The math behind the odds ratio method
In the odds ratio method, we calculate the odds ratio and the confidence interval of the odds ratio using the delta method. The steps are:
- Calculate the standard error (SE) of the log odds ratio
- Calculate the log confidence interval (CIlog) from the log of the odds ratio and the standard error of the log odds ratio
- Exponentiate to get the confidence interval (CI)
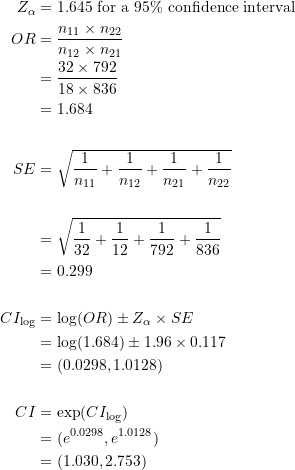
So, let’s walk through the math. The formulas are as follows. Let n11 through n22 be the cells of the above 2×2 matrix. Then:

Note that this method provides not only the sales lift itself (as the odds ratio), but also the a confidence interval for the sales lift.
Calculating the odds ratio and the confidence interval
Now, we also need to select a confidence interval. Suppose that we want a 90% confidence interval. We can look up the appropriate value for Zα in a table for confidence intervals. The value is 1.645 for a 90% confidence interval.
When we run through the calculations:

Thus, the odds ratio of our A/B test was 1.684. In other words, customers receiving the test offer were 1.684 times more likely to accept, compared to customers who received the control offer.
The 90% confidence for the confidence interval for the odds ratio ranges from 1.03 to 2.75. In other words, our test approach will be between 1.03 to 2.75 times more effective than our control approach, 90% of the time, if this test were to be repeated.
And, for the purpose of illustration, here’s some simple Python code:
import numpy as np

z = 1.645  # for a 90% confidence interval
n11, n12, n21, n22 = 32, 18, 836, 792
odds = (n11*n22)/(n21*n12)
se = np.sqrt(1/n11 + 1/n12 + 1/n21 + 1/n22)
logCI = (np.log(odds) - z*se, np.log(odds) + z*se)
CI = np.exp(logCI)
Personally, while I still find the theoretical basis behind the delta method challenging at times, the actual math and the code is not that bad.
When to Use Each Method to Calculate Sales Lift
Finally, when should we use each method? It depends more on the intended audience than on personal preference.
Pros and cons of the percentage method
The benefit of the percentage method is that it is intuitive and easy to calculate. It is the most widely used method. It communicates a simple and powerful story to the audience. I would feel confident using the percentage method both for a class homework assignment and for an executive presentation to the CEO.
However, the percentage method also has the drawback of ignoring information about our data. For example, in the example above the lift was about 15%. We may want to know how much of that improvement was due to the new approach being more effective, and how much was simply due to chance.
If I told you that 12% of the improvement was due to randomness and only 3% due to the new design, then the results sound less impressive. In addition, the results may not be replicable. Further experiments could show vastly different results.
Now, there are ways to mitigate these concerns. For example, we can also calculate both lift and effect size. Calculating effect size using a metric like Cohen’s d allows us to account for the randomness inherent in the data.
Pros and cons of the odds ratio method
In contrast, the odds ratio method is grounded in a powerful statistical technique. It provides a calculation for the sales lift (in the form of an odds ratio), but also a confidence interval for the sales lift. Coda Strategy also has additional examples of the odds ratio method with additional marketing examples.
On the other hand, the odds ratio method is far less widely known or widely used. It primarily appears in academic research, where authors expect their readers to have a firm grasp of statistics. However, if the primary audience is data scientists who understand how to use a confidence interval, then the odds ratio method provides valuable additional insight.
Conclusions
As marketing departments increase their use of experimentation to drive business results, their demand for practitioners who understand marketing analytics will continue to grow. Thus, it is important to have a solid foundation in the mathematics behind marketing analytics. One of the most important metrics is sales lift. There are two methods to calculate sales lift:
- The percentage method
- The odds ratio method
While the percentage method is by far the most popular approach to calculate sales lift, the odds ratio method can provide additional insight through a powerful statistical technique. Which method you choose should depend on your target audience and your intended message.


